The sizes of the reduced networks and the corresponding
computational time speed gains are tabulated in Tables ![]() ,
,![]() . As
can be clearly seen, the reduction is more efficient for the
gas-phase chemistry than for the gas-grain chemistry. One reason is
that in the latter case it is necessary to keep almost all surface
species in the network since accretion and desorption processes
become very important after about
. As
can be clearly seen, the reduction is more efficient for the
gas-phase chemistry than for the gas-grain chemistry. One reason is
that in the latter case it is necessary to keep almost all surface
species in the network since accretion and desorption processes
become very important after about ![]() years of the
evolution. Another reason consists in the fact that dust surface
reaction rates are much larger compared to the rates of gas-phase
reactions, therefore a lot of these reactions are deemed to remain
in the network.
years of the
evolution. Another reason consists in the fact that dust surface
reaction rates are much larger compared to the rates of gas-phase
reactions, therefore a lot of these reactions are deemed to remain
in the network.
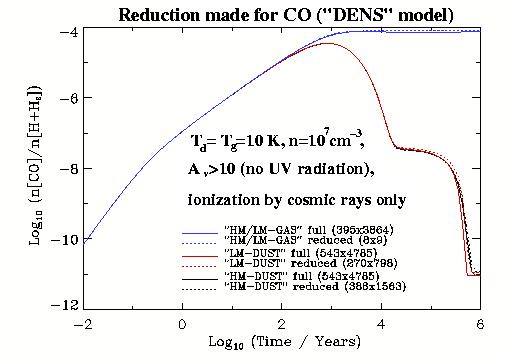
The most interesting results are illustrated in Figures ![]() ,
,![]() . In
Figure
. In
Figure ![]() we plot relative abundances of CO molecule in respect
to hydrogen nuclei obtained with the full and reduced networks for
the conditions of dense clouds (``DENS'' model). It can be clearly
seen from the dramatic decrease of the CO gas-phase abundances in
the case of gas-grain chemistry (red and black lines) that accretion
onto dust grains proceeds very efficiently under such low
(
we plot relative abundances of CO molecule in respect
to hydrogen nuclei obtained with the full and reduced networks for
the conditions of dense clouds (``DENS'' model). It can be clearly
seen from the dramatic decrease of the CO gas-phase abundances in
the case of gas-grain chemistry (red and black lines) that accretion
onto dust grains proceeds very efficiently under such low
(![]() K) temperatures and high (
K) temperatures and high (![]() cm
cm![]() ) density. One may
understand the effects of the gas-grain interactions, discussed
above by looking on the shape of the curves. For the pure
gas-phase chemistry (blue lines), behaviour of the abundance
evolution curve for CO is simple: it grows exponentially
till chemical equilibrium is reached around
) density. One may
understand the effects of the gas-grain interactions, discussed
above by looking on the shape of the curves. For the pure
gas-phase chemistry (blue lines), behaviour of the abundance
evolution curve for CO is simple: it grows exponentially
till chemical equilibrium is reached around ![]() years and then
it becomes a constant. As indicated on the figure, only
years and then
it becomes a constant. As indicated on the figure, only ![]() species
and
species
and ![]() reactions are necessary to reproduce the evolution of CO
abundances accurately in this case. The corresponding computational
speed-up factor is more than
reactions are necessary to reproduce the evolution of CO
abundances accurately in this case. The corresponding computational
speed-up factor is more than ![]() .
.
On the contrary, for the gas-grain chemistry the behaviour of the CO
evolution curves are not trivial: the equilibrium can be reached
only after ![]() years since the gas-dust interaction
becomes of great importance. Obviously, in this case one needs to
hold more chemical species and reactions in the reduced networks in
order to follow the evolution of CO abundances with a reasonable
accuracy. The corresponding computational time gain is the order of
ten.
years since the gas-dust interaction
becomes of great importance. Obviously, in this case one needs to
hold more chemical species and reactions in the reduced networks in
order to follow the evolution of CO abundances with a reasonable
accuracy. The corresponding computational time gain is the order of
ten.
Surprisingly, there is almost no difference between abundances computed with the high and low metalicities for the same chemical models. It reflects the fact that CO-chemistry is sensitive mainly to the amount of C, O, and H available in the gas-phase, which is the same for the both metalicity cases.
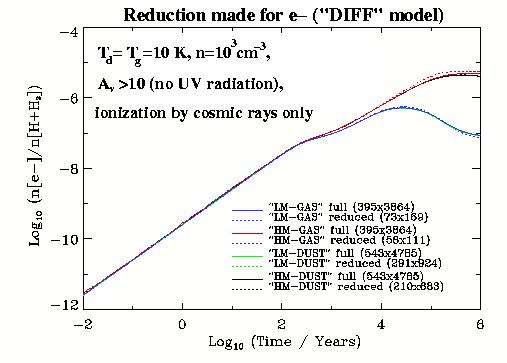
We present the evolution of the ionization degree computed with the
full and reduced networks for the conditions of dark diffuse clouds
(``DIFF'' model) in Figure ![]() . One may point out that
compared to Figure
. One may point out that
compared to Figure ![]() there is no great difference for
the fractional ionization degree calculated with the pure gas-phase
and gas-grain chemical networks. It implies that the gas-grain
interaction is not efficient anymore under such low (
there is no great difference for
the fractional ionization degree calculated with the pure gas-phase
and gas-grain chemical networks. It implies that the gas-grain
interaction is not efficient anymore under such low (![]() cm
cm ![]() ) density since the typical timescale of collisions
between dust grains and gas species are far too large.
) density since the typical timescale of collisions
between dust grains and gas species are far too large.
In contrast to Figure ![]() there is a difference between
``high metals'' and ``low metals'' cases. In the high metalicity
case metal ions, like Na
there is a difference between
``high metals'' and ``low metals'' cases. In the high metalicity
case metal ions, like Na![]() , Mg
, Mg![]() , dominate the regulation of
the ionization degree. For the ``low metals'' initial
abundances, typical dominant ions are more complicated chemical
species, like H
, dominate the regulation of
the ionization degree. For the ``low metals'' initial
abundances, typical dominant ions are more complicated chemical
species, like H![]() and HCO
and HCO![]() since the metals are heavily
depleted from the gas phase. Typical computational speed gain can be
as large as
since the metals are heavily
depleted from the gas phase. Typical computational speed gain can be
as large as ![]() for the gas-phase chemistry and as small as
for the gas-phase chemistry and as small as
![]() for the gas-grain.
for the gas-grain.
A possible application for reduced chemical networks would be the modelling of the evolution of magnetized protostellar clouds or protoplanetary accretion discs, when it is necessary to compute the ionization fraction self-consistently, accurately and rapidly.
The results of this work were reported in Budapest, 15-18 May 2002,
during the conference ``Interaction of Stars with their
Environments II'' [15].
 |
 |